Safety days vs service level
Both ROP modes start from demand and lead time; safety days adds fixed buffer days per ABC class, service level sizes it from demand variability.
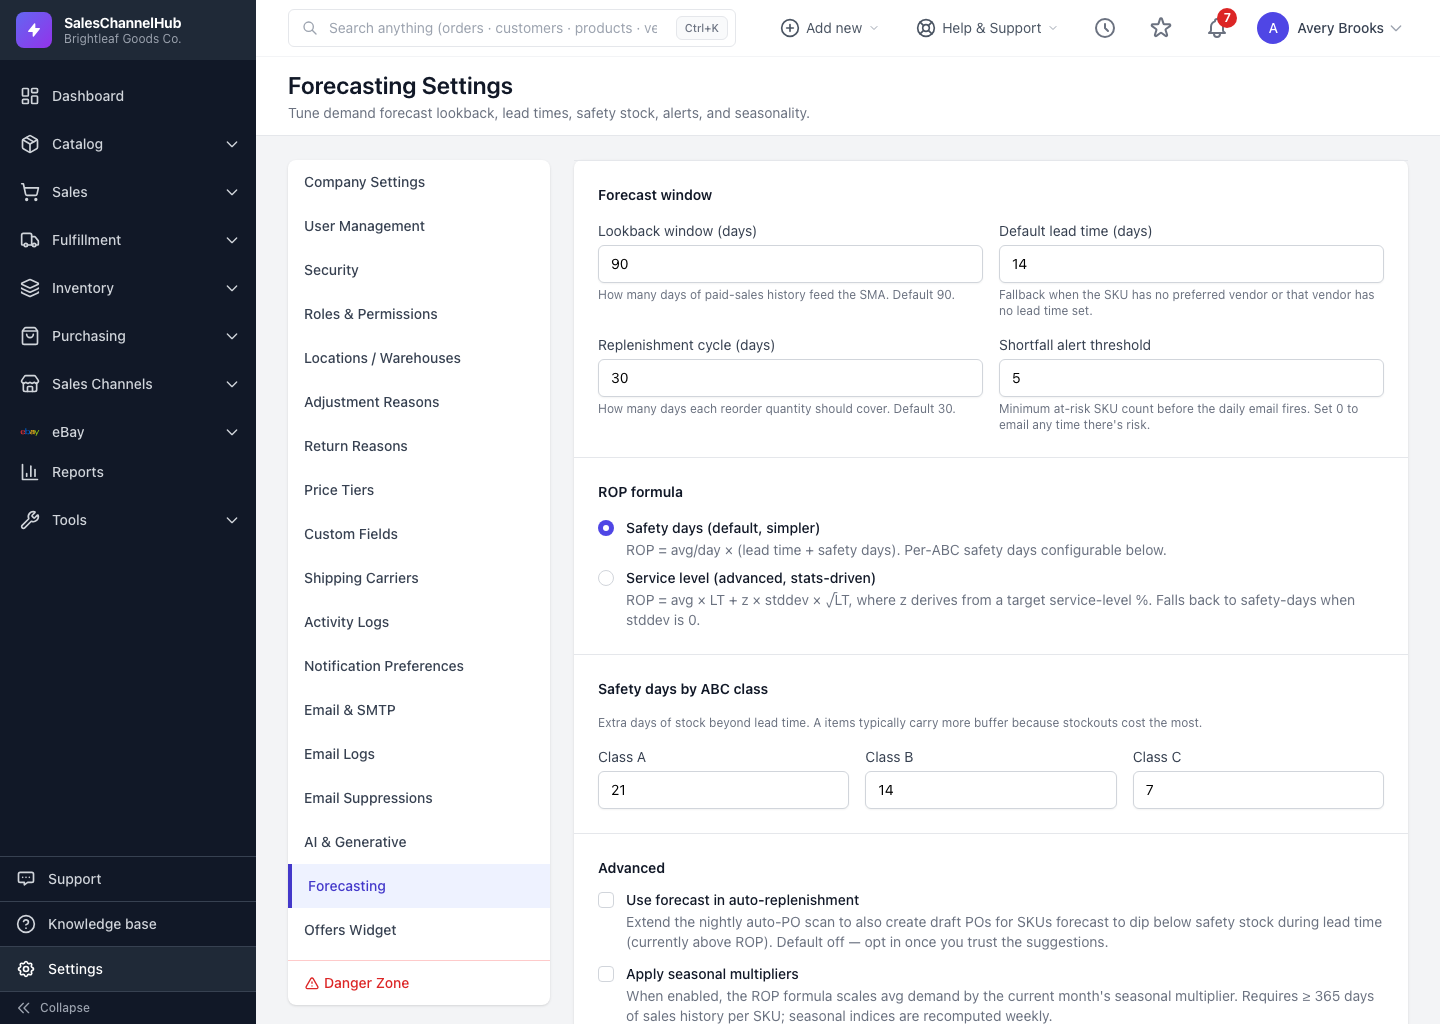
Under Settings → Forecasting you pick how reorder points are sized. Both modes start from your average daily demand and lead time, then add a safety buffer. They just decide that buffer differently.
How does safety days work? (the default)
- Adds a fixed number of extra days of stock per ABC class on top of lead time.
- Easy to reason about: keep three weeks of buffer on A items.
- Set Class A, B and C independently. A items usually get the most.
How does service level work? (advanced)
- You set a target percentage chance of not stocking out per cycle: 80, 85, 90, 95, 98 or 99.
- The buffer is then sized from how erratic that SKU's demand is. Steady sellers need little buffer; spiky ones need more.
- If a SKU's demand is perfectly flat, it quietly falls back to the safety-days math.
Which should I choose?
- Start with safety days. It's predictable and easy to explain.
- Switch to service level once you have solid history and want buffers that react to demand volatility on their own.
Tip. Higher service levels mean fewer stockouts but more cash tied up in stock. 95–98% for A items and 90% for C is a sensible starting spread.
Common questions
Does service level always need historical variability?
It uses it when there is some. If a SKU's demand is perfectly flat (zero variability), the service-level mode falls back to the safety-days calculation for that SKU.
What service level percentages can I set?
Values are snapped to the nearest of 80, 85, 90, 95, 98 or 99 per ABC class. Higher means fewer stockouts but more stock on hand.