Read the sync logs
The Logs page lists every sync run for a connection with its entity, direction, status and counts, and you can filter the list.
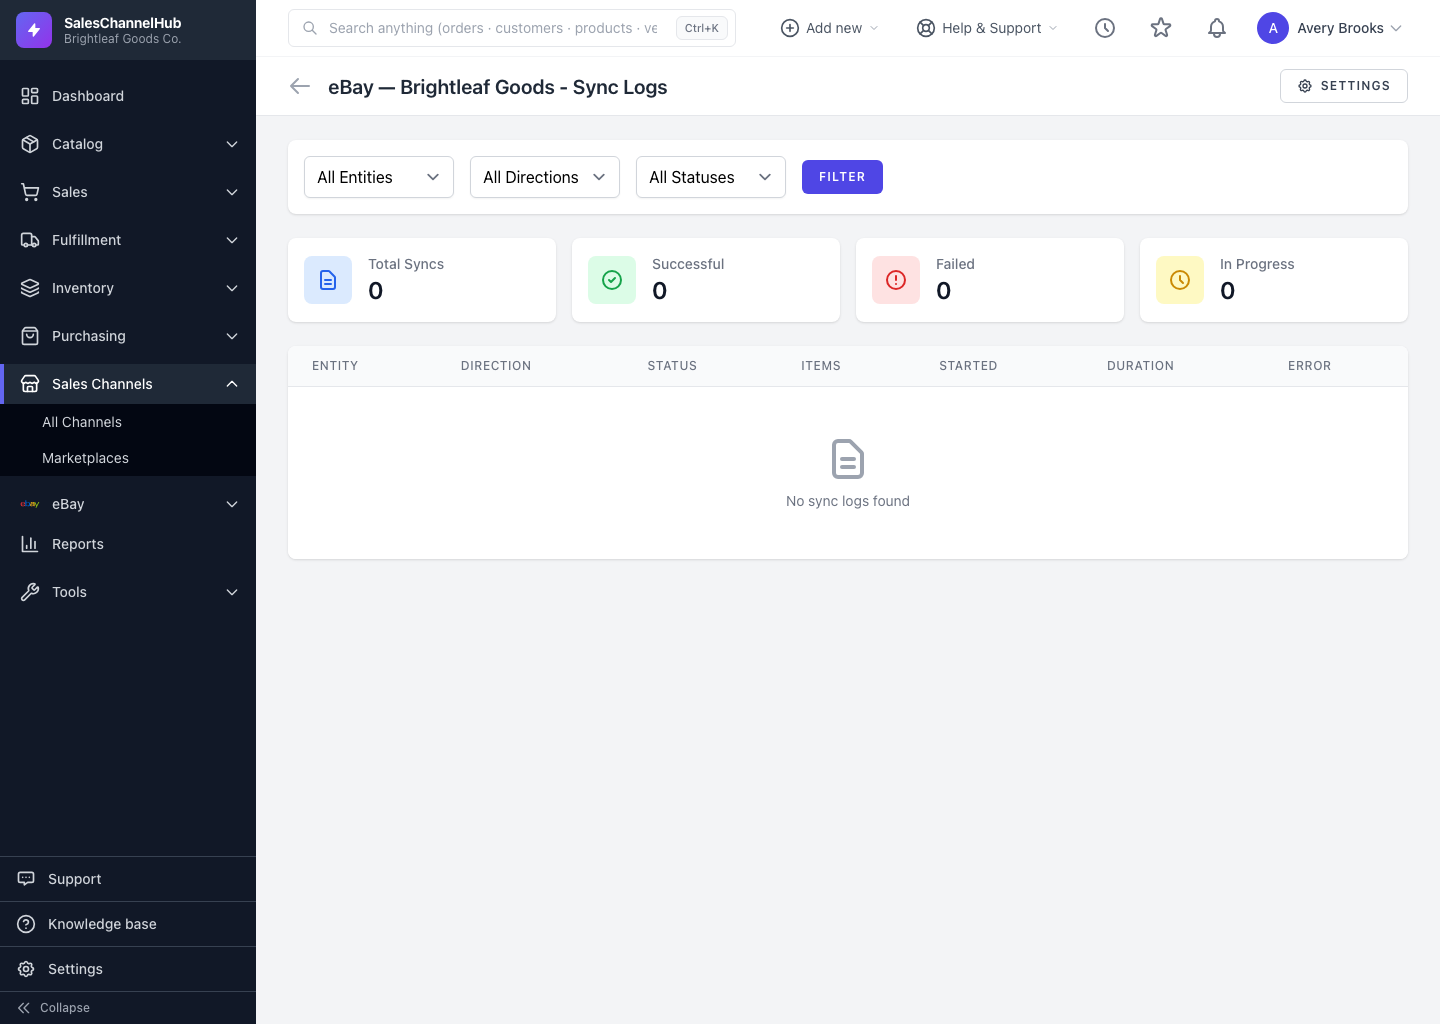
The sync logs are your audit trail for a connection: every push and pull, when it ran, how long it took, and how many records it touched. Open them from Logs on the connection's row.
How do I read the logs?
- The four cards at the top show Total Syncs, Successful, Failed and In Progress at a glance.
- Each row shows the Entity, the Direction (Push or Pull), the Status, item counts, when it Started, the Duration, and any error.
- Item counts use shorthand:
+created,~updated,-failed.
How do I narrow the list?
- Set the All Entities, All Directions and All Statuses dropdowns.
- Click Filter to apply them. Click a row to open its full details.
Tip. While a sync is still running, this page refreshes on its own, so you can watch progress without reloading.
Common questions
What do the +, ~ and - symbols in the item counts mean?
+ is records created, ~ is records updated, and - is records that failed. They give you the shape of a run at a glance.
Do I need to reload to see a sync finish?
No. While a sync is In Progress, the Logs page refreshes on its own so you can watch it complete.
Was this article helpful?