Group rows and add summary totals
Tick Group & aggregate, add a dimension under Group by, then add measures (Count, Sum, Average, Min, Max) to turn a list into totals.
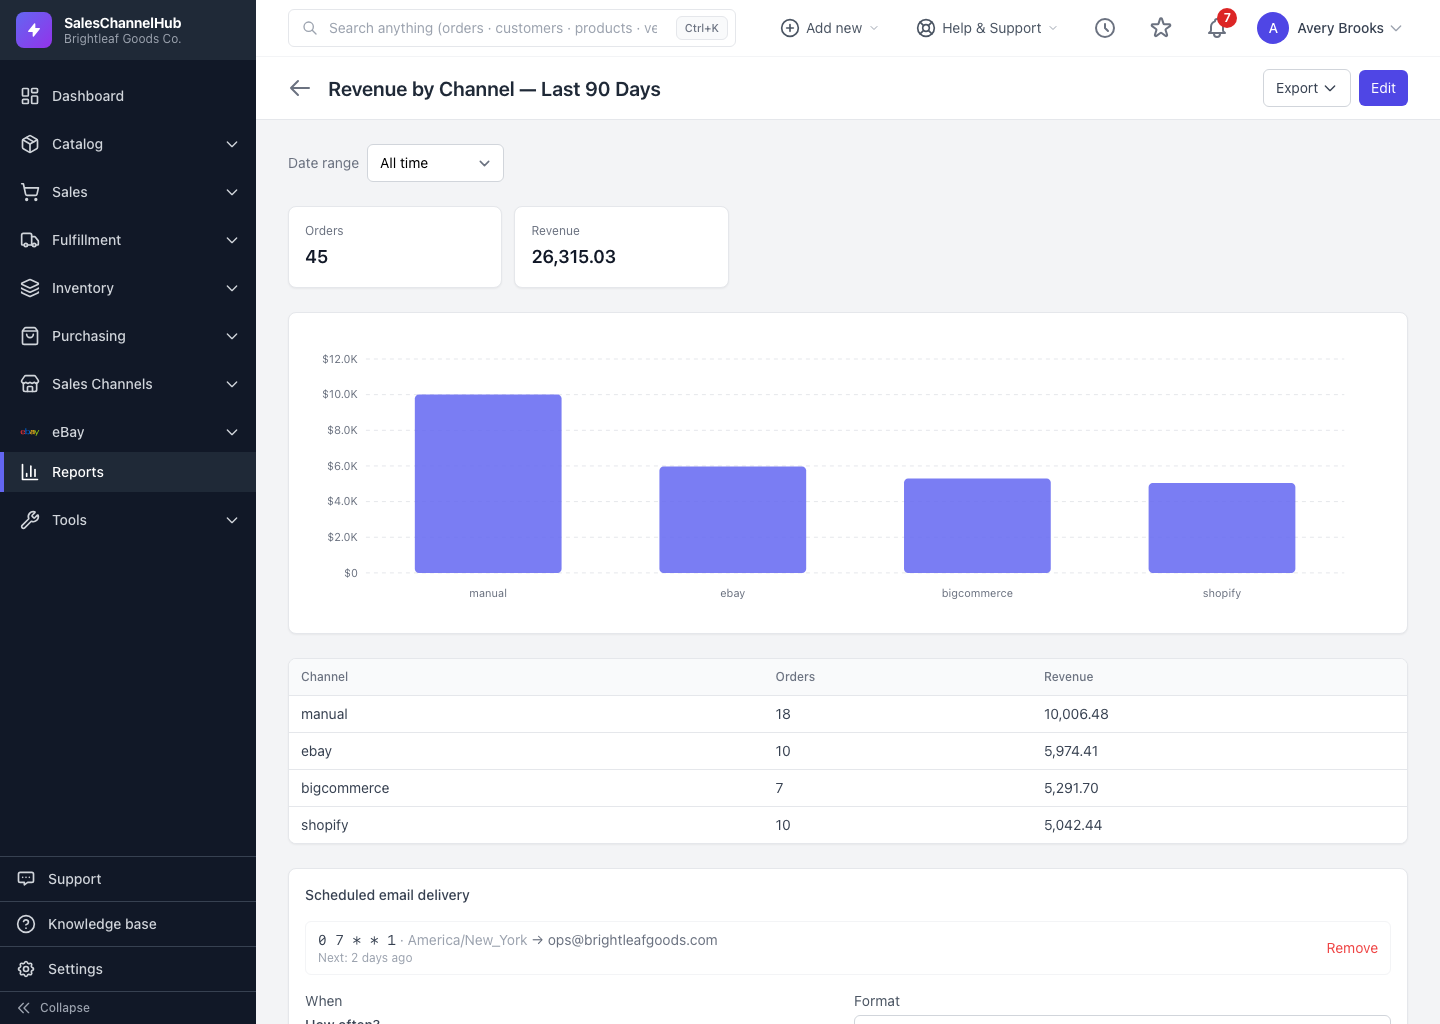
Summary mode rolls many rows up into totals: revenue by channel, units by product, stock value by location. Switch it on in the Summarize section.
How do I group and total a report?
- Tick Group & aggregate (summary mode).
- Under Group by, click + Dimension and pick a field to group on, for example sales channel or product. For dates you can pick a bucket such as by day, week or month.
- Under Measures, click + Measure and choose a function: Count, Sum, Average, Min or Max. Pick the field to aggregate (Count needs no field) and give it a label.
- Add more dimensions or measures as needed, then save.
Where do the grand totals show?
When you run a summary report, the totals across the whole result appear as headline cards at the top. You get the grand total and the per-group breakdown in one view.
Tip. Bucket a date dimension by month for a clean trend, by day for recent detail. The bucket dropdown only appears once you pick a date field to group on.
Common questions
What's a dimension versus a measure?
A dimension is what you group by, such as channel or product. A measure is what you total within each group, such as a count of orders or a sum of revenue.
Why doesn't my Count measure need a field?
Count tallies the rows in each group, so it needs no field. Sum, Average, Min and Max each operate on a specific field, so you choose one for those.
Can I group by more than one thing?
Yes. Click + Dimension again to add another group level, for example channel then month. The summary nests the groups in the order you add them.