Read the dashboard
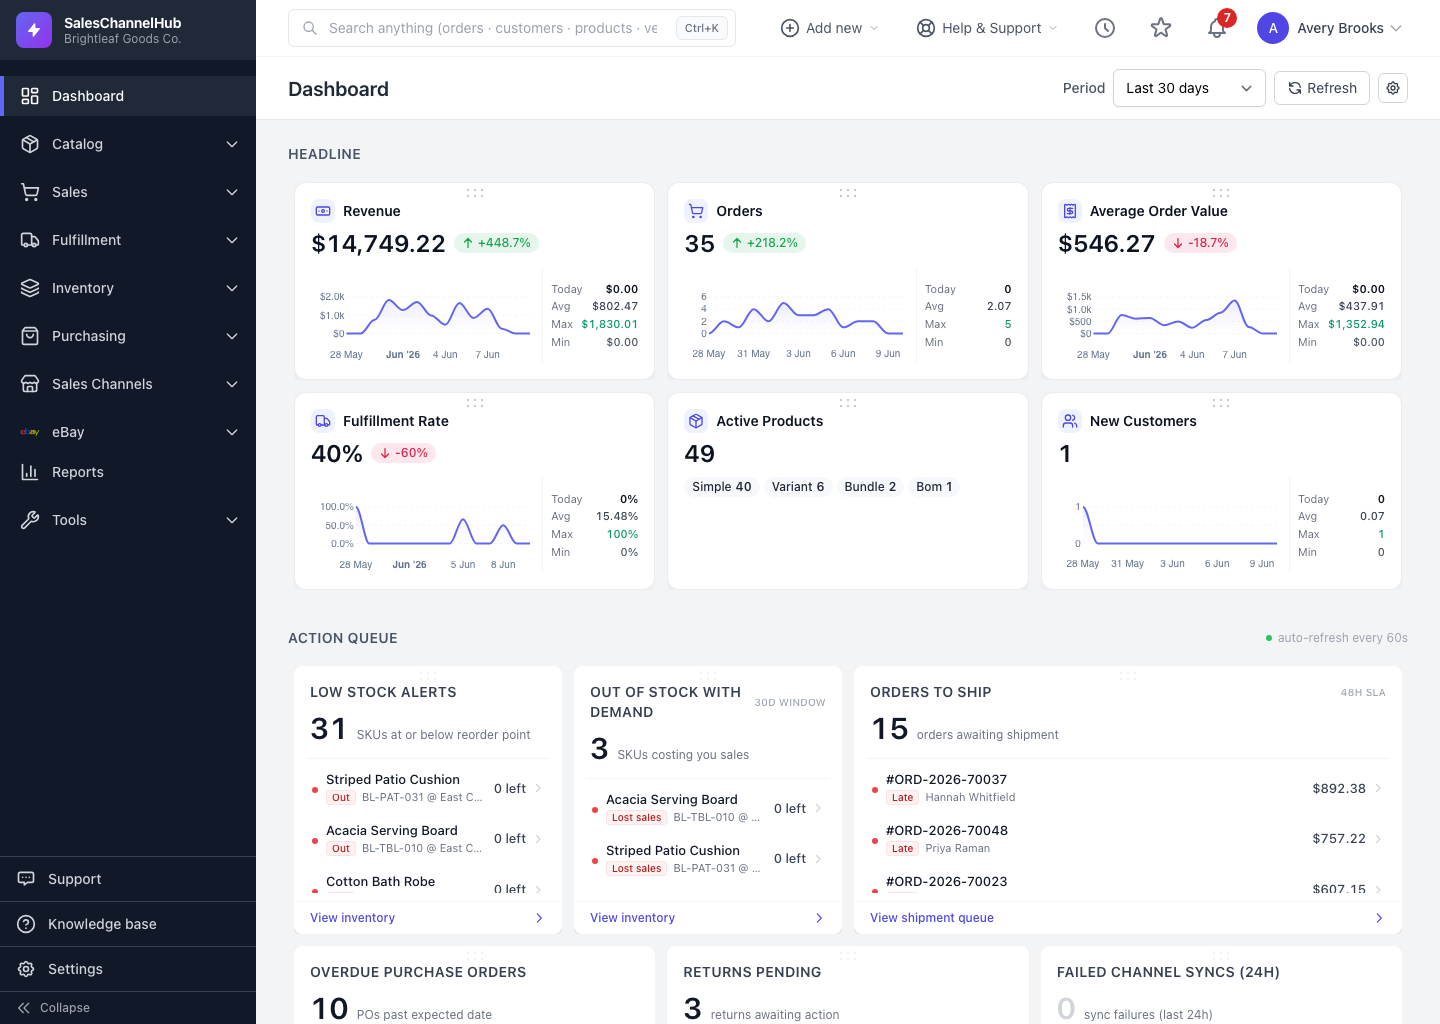
The dashboard summarizes the business in four stacked sections you read top to bottom: Headline, Action Queue, Charts, Operations.
The dashboard summarizes the whole business in four stacked sections, so you can scan its state from top to bottom in seconds.
What are the four sections?
- Headline — your key numbers: revenue, orders, average order value, fulfillment rate, active products and new customers, each with a trend and a change against the previous period.
- Action Queue — counts of work that needs attention (orders to ship, sync failures), with the items listed underneath.
- Charts — visual trends across the period you've selected.
- Operations — list widgets for channels, inventory, finance, customers and recent activity.
Tip. A green up-arrow on a headline card means the metric rose versus the previous period; red means it fell. The percentage beside it is the size of the change.
Was this article helpful?